 Let’s get this out of the way. 100% accuracy does not exist in website analytics. Repeat. 100% accuracy does not exist in analytics.
What does exist in analytics is data – lots of it – and with this comes fear.
Fear of looking at the wrong data. Fear of where to start. Fear of analytics failure.
This fear will only dissipate with knowledge. Knowing that analytics will never be perfect is a critical first step and a cornerstone shared during the session ‘Deep Dive Into Analytics’ at SES San Francisco.
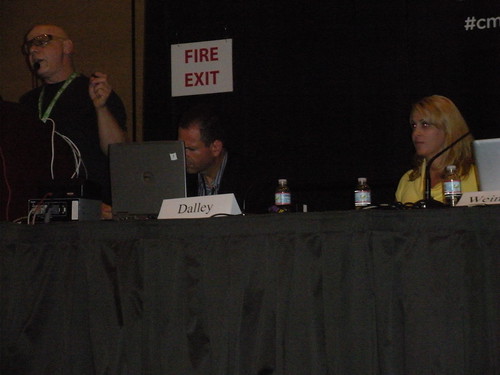
Bryan Eisenberg, SES Advisory Board and NY Times bestselling author, moderated this session which included on its panel:
- Tami Dalley, Director, User Experience Optimization, ROI Labs
- Marty Weintraub, President, aimClear
- Matthew Bailey, SES Advisory Board & President, Site Logic Marketing
The beauty of an analytics session at SES is that those on the panel may sometimes be analysts or they may sometimes be statisticians, but they are always marketers. And a good marketing analyst knows that it’s the facts that tell and the stories that sell.
As such, Bailey shaped his presentation around four key points that make up the bulk head of the website analytics story:
- Intent
Every visitor that lands on your website is there for a reason. Bailey offers the example of a jewelry store pulling traffic for ‘watch’ based keywords. Within this segment, some will be looking to ‘buy a rolex’ while some will be looking to ‘fix a watch + san francisco.’ Based on the keywords this segment used to find your site, did content match intent? - Expectancy
Similar to intent, but expanded to include referring sites ranging from forums to blogs. Did the source that referred the segment, say a forum about watch repair stores in San Francisco, shape user segment expectations accurately in regards to what they found on your site? - Reaction
What ultimately happened when the segment of users arrived on your site? Did they bounce immediately? Convert? Did they do what you intended them to do? - Behavior
Whether the user bounced, exited or converted, what behavioral clues did they drop along the way? Did they bounce after a mere ten seconds? Exit after visiting multiple pages? Convert directly from where they landed or within just one step?
Remove these items from a numbered list, and add context, and this becomes an actionable story:
Users arriving at my site using San Francisco watch repair related keywords, or coming from local websites geared towards watch repair services, are bouncing at a rate of 85% and converting at a rate of 4%. However, those that land on my Rolex repair services page from this same segment bounce at a rate of 60% and convert at a rate of 10%. If I optimize my Rolex repair page for ‘rolex repair + san francisco’, I may capture more conversions.
Of course, the answer is never quite so simple. Dalley and Weintraub illustrate this as they share detailed real world case studies and conversion reports, respectively.
Dalley’s case studies detail how the slightest change, from a page’s design to a customer’s location, can drastically shape results. The key to making an actionable change is to start with an educated hypothesis before backing it up with the right data for proof points.
And this means overcoming a fear of data and digging in, as repeated by Bailey.
Since Weintraub is sorely misrepresented in this post, primarily because nearly any written word would be a severe injustice to the energy level he brings to his presentation, below find potential conversion reports or data ‘dig-in points.’ These are reports that you can pull from your analytics to make a decision from today. The list below was both leveraged from and inspired by a list of deeply ‘unsexy’ (Weintraub’s words, not mine) possible conversion reports shared during this session:
- Conversion by time of day
- Conversions by rural Pennsylvania city
- Conversions by mobile device
- Conversions by web browser
- Conversions by keywords containing the keyword ‘green dress’
Please add your own unsexy, or even sexy, conversion reports or analytics stories via a comment below.


