I love infographics as a marketing tool, don’t you? They can convey a huge amount of information in a compact form. It’s an easy way to hit the highlights of your chosen topic without losing the reader to text fatigue. 90% of information transmitted to the brain is visual, so it makes sense that infographics are more effective than text alone.
Where did I get that 90% stat? An infographic, of course!
Because as much as I enjoy using infographics as a marketing tool, I enjoy reading them even more. We marketers have brains that operate the same way as anyone else (well, maybe we’re more creative and a tad bit more clever). So we get the same value out of good infographic.
There is no shortage of visually impressive, information-packed infographics by marketers, for marketers. Here are just a few I’ve seen in the past month. Read on to be infotained by infographics on content, SEO, blogging, and…er…infographics.
7 Must-See Infographics by Marketers, for Marketers
#1 – Portrait of a Content Marketer: More than a Marketer
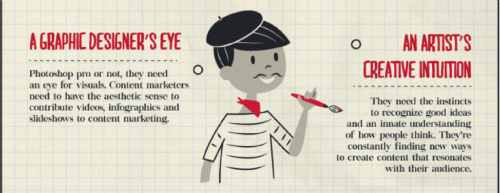
Don’t worry; there are plenty of educational infographics on this list. But let’s start with a lighter one, because this is one of my new favorites. It’s the rare beast that is the inspirational infographic. It may be light on facts and figures, but it’s heavy on the emotional appeal. The retro children’s book illustrations are spot on, too.
#2 – What Makes Content Compelling? An Analysis of 3 Top-Performing Articles
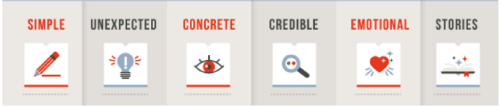
In this infographic, The smarties at Fractl break down the components of a diverse mix of articles to find the common strands that lead to content success. They identify six basic building blocks of an article that gets shared (see above) and show how each article hits each one. The infographic shows how these three articles earned 144,000 social media shares between them. I like that the “building block” idea isn’t completely proscriptive. It doesn’t offer a formula to follow to generate clickbait; instead, the infographic shows how truly diverse good storytelling can be.
#3 – Seven Common Blogging Mistakes to Avoid
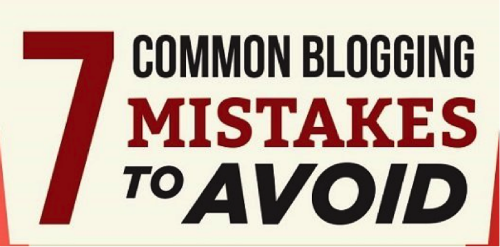
This graphic from WhoIsHostingThis? proves that you can fit a lot of content into an infographic without it feeling too cluttered. This is practically a blog post, but it still packs in plenty of compelling visual content. The ‘cutting through the hype’ formula works well here, too. Even a seasoned content marketer will get some of their conventional wisdom turned upside down.
#4 – The Mixology of Content Marketing
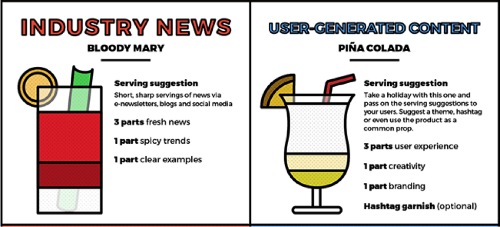
UK agency JBH presents this beautiful marriage of two of my passions in life. Margarita. Martini. Marketing. It can’t be a coincidence, can it? Marketers will find plenty of recipes for successful content here, along with a garnish of content marketing stats. For example, video will be responsible for 79% of all consumer web traffic by 2018. Time to start animating those infographics…
#5 – The Potential of Social Media for B2B in 2016
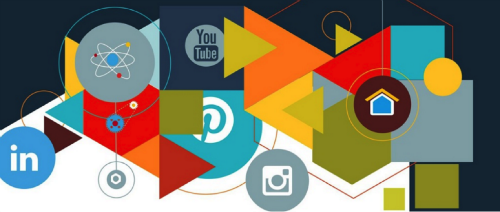
The swinging retro design of this piece helps break up the stat-heavy content. There is simply a ton of researched information on display here, from social media advertising spend to the true number of active users on the major platforms. My favorite stat: When a brand is followed on Twitter, 72% of the followers are likely to make a future purchase from that brand.
#6 – The Pros and Cons of Facebook, Twitter, Instagram & Other Social Networks
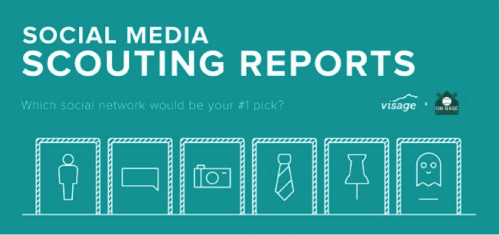
Compared to the previous entry, the design on this one is almost demure–it certainly isn’t out to dazzle with eye-popping color or adventurous layout. But it excels at presenting valuable information in an easily digestible way. I was surprised to see that Pinterest only has 100 million active users–given my Facebook feed, it seems like a lot more.
#7 – The Science Behind Infographics
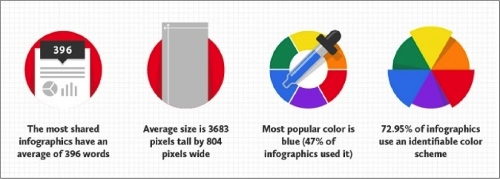
What better way to wrap up an infographic post than with an infographic about infographics? This graphic from Siege Media hits everything from colors to word count to what types of industries do best with infographics on each social media platform. The best part: the infographic itself demonstrates the results of Siege Media’s study; it’s the average size and wordcount that their research uncovered.
Infographics are a valuable tool for marketers, whether we’re creating them or consuming them. I hope these seven examples inspire you to make great visual content of your own.
What’s your favorite marketing infographic? Let me know in the comments.


